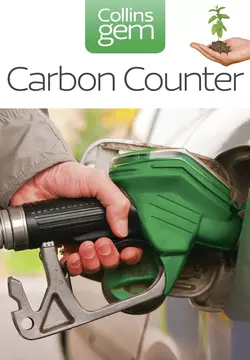
Carbon Counter
Mark Lynas
What effect are you having on the environment? If you buy Kenyan green beans what is the CO2 cost? What about your journey to work, your fridge or your clothes? The Gem Carbon Counter is your portable instant green reckoner.This handy little book includes:• Introduction by Mark Lynas author of Hide Tide: News from a Warming World• Welcome to the Greenhouse: Explains what the Greenhouse effect actually is, all the issues surrounding global warming and your carbon footprint?• Your Carbon Footprint: Measure your own carbon footprint covering all aspects of your life from your food shopping to your work, holidays and clothes. Starting with your home gas and electricity supplies and usage, the handy green reckoner takes you through each part of your life and helps you add up the impact you are making on the environment. So, in turn, it allows you to identify the key parts of your life which you’ll need to adapt to reduce your carbon footprint: from which coffee you drink to how often you go on holiday.• Sustainability: How do you measure up in comparison to the average person’s carbon footprint? What can you do to generate your own energy and therefore reduce your footprint and what sort of targets can you set yourself?• Helpful Appendices: Includes information on carbon emissions for journeys by car, train and plane. A list of corporate companies, their emissions and what they are doing to reduce their carbon footprint so that as a consumer, you can make decisions on who you support. A helpful carbon diary where you can record your carbon footprint for the year. Useful websites where you can read more about green issues.
Carbon Counter
Table of Contents
Cover Page (#ue234918d-e0d7-588f-a96f-ccaa40ed8687)
Title Page (#u9f19980f-4986-59a6-ad77-5af84a9f7477)
INTRODUCTION (#u85e95a94-edb0-5ddd-86f4-97981e3c4fae)
I Welcome to the greenhouse (#ue9f35a35-181c-5981-8960-f1fd1f5d314d)
II Your carbon footprint (#litres_trial_promo)
III Sustainability (#litres_trial_promo)
Appendices (#litres_trial_promo)
Your carbon diary (#litres_trial_promo)
Useful websites (#litres_trial_promo)
INDEX (#litres_trial_promo)
Copyright (#litres_trial_promo)
About the Publisher (#litres_trial_promo)
INTRODUCTION (#ulink_a8429c8e-3d38-5a5d-bb92-91eed55ffcc2)
You’ve heard of counting carbs. This book is about counting carbon. It’s not the health of your body that is the object of our interest this time, but the health of the planet. Carbon dioxide is the main gas responsible for global warming, and humans are producing 25 billion tonnes of the stuff every year, raising the temperature of the planet to dangerous levels. This book will help you bring down your personal contribution to this rather daunting problem.
According to the government’s chief scientist Sir David King, global warming is the greatest problem facing humanity. It’s therefore a bit of a tall order to solve it all on your own. But if enough people begin to count and reduce their carbon, the rate of climate change can be slowed down dramatically.
This could save countless species from extinction, as animals like the polar bear and Bengal tiger will have nowhere to go as the world warms. It could also save the lives of the millions of people who are at risk from rising seas in low-lying areas. But if we don’t act, vast swathes of the globe could be rendered uninhabitable because of flood, drought and searing heatwaves.
So by ceasing to be part of the problem and instead becoming part of the solution, you can join a growing movement to cut back humanity’s carbon emissions before it is too late – and many scientists suggest that the atmosphere’s ‘tipping point’ will come within the next decade, giving us no time to dither before making dramatic cutbacks. The lifestyle change that this implies doesn’t necessarily mean misery and sacrifice: low-carbon living means that we should all end up fitter and healthier too. So maybe – the planet aside – counting carbs and counting carbon aren’t so different after all.
I Welcome to the greenhouse (#ulink_2dcfa4ac-a54c-5d07-a863-17a3d808d5bc)
THE GREENHOUSE EFFECT
Contrary to what you might have heard, the greenhouse effect is not all bad. Without the heat-trapping effect of certain gases, the average temperature of the planet would be a decidedly chilly -18°C. Nor is it a new discovery. The Irish physicist John Tyndall was the first to realize, back in 1859, that without greenhouse gases in the atmosphere, things would quickly turn unpleasantly cold. As he wrote (a little melodramatically), without these heat-trapping gases, ‘the warmth of our fields and gardens would pour itself unrequited into space, and the sun would rise upon an island held fast in the iron grip of frost’. (Tyndall did well on the lecture circuit.)
Tyndall correctly identified that the two most common gases in the air, nitrogen and oxygen, are transparent to heat radiation. Instead, it is gases present in much smaller quantities – water vapour, carbon dioxide, methane and others – which have the heat-trapping effect. No one disputes this ‘natural greenhouse effect’, as it can be demonstrated easily enough in the laboratory. The arguments (for climate change is nothing if not controversial) come later.
Not all greenhouse gases are born equal. Carbon dioxide gets most attention because it is the most abundant, and lasts a long time in the atmosphere. Water vapour is also a greenhouse gas, but its emissions are more or less irrelevant because it condenses out as rain in a matter of hours or days. (The exception to this is water vapour emitted high in the atmosphere by aircraft, where it can have a longer-term warming effect.) The table below details the different gases and their ability to trap heat – their ‘global warming potentials’ – as well as their atmospheric lifetimes.
GREENHOUSE GASES
‘Global warming potential’ means the potential each gas has to trap heat over a given period of time, just as different ratings are applied to measure the heat-trapping strength of different duvets on a bed!
The greenhouse effect can also be observed on other planets in the solar system. Venus has a hotter surface temperature than Mercury, despite being much further away from the sun. Because the Venusian atmosphere is almost entirely composed of carbon dioxide, this gives it a phenomenally strong greenhouse effect – keeping surface temperatures at 460°C, hot enough to melt lead.
All of this would interest no one other than chemists and astronomers if the amounts of these gases in the earth’s atmosphere were to stay fixed. From the Industrial Revolution, humans began exploiting fossil fuels – coal, then oil and gas – for energy. These fossil fuels burn to produce carbon dioxide, which then accumulates in the atmosphere over the decades and centuries.
In 1750 there were 278 parts per million (ppm) of carbon dioxide in the earth’s atmosphere. Now that figure has risen to 380ppm, and it is continuing to rise at 1.5 to 2ppm per year. Methane levels have risen from 700 to 1745 parts per billion, while nitrous oxide has jumped from 270 to 314ppb. The other gases – CFCs, HFCs and SF
– are entirely products of the industrial age, so did not exist in 1750. But now that they do, many will be with us for a very long time, as the right-hand column of the table on page 9 shows.
Put these changes in a geological context, and it all begins to sound a bit scary. Carbon dioxide levels haven’t been this high on earth for millions of years. The temperature of the planet rose and fell with the cycles of the ice ages, but during the whole time carbon dioxide levels were lower than they are now. But as the graph on page 12 shows, temperature and carbon dioxide shadow each other very closely over the long term, suggesting that our increase in CO
will indeed be followed by a temperature increase.
WHAT ARE FOSSIL FUELS?
Fossil fuels are often termed ‘buried sunshine’, because, in essence, they represent energy captured from the sun by photosynthesis in ancient plants. By using fossil fuels, humans are getting an effective
Tip: If you think about it, all the energy humans have ever used has come from the sun. Cavemen burned wood in fires for heat and cooking, but the trees it came from used the sun’s energy.
CO2 AND ESTIMATED GLOBAL AIR TEMPERATURE
Ice cores drilled by glaciologists from Antarctica provide a good record of temperature and greenhouse gas fluctuations over the ages. Two things are striking: first, how closely correlated temperature and CO
are; and second, how much higher levels are now than during the whole period of record.
energy subsidy from the past. Before the discovery of coal, oil and gas, humans – like other animals and plants – had to live only from the energy provided directly by the sun.
Coal: Coal is the fossilized remains of ancient forests. Many of these forests built up thick layers of peat underneath them, much as do forests today in hot tropical areas like Indonesia. Over millions of years, this peat became compressed by layers of sediment above it, and turned gradually to carbon-rich coal. A prime coal-forming era was the Carboniferous period (300–360 million years ago), which was named after the extensive coal beds found in Western Europe. Most of the electricity produced worldwide comes from coal.
Oil: Unlike coal, oil begins its formation in the sea. The dead remains of plankton accumulate in bottom sediments, where they are eventually buried at great depths and heated up by geothermal processes. This then ‘cooks’ the dead algae, releasing hydrocarbons, which companies such as Esso and BP later hope to drill out from reservoirs of oil trapped between impermeable rocks. If the oil is cooked at too high a temperature, it instead forms gas (see page 15). Saudi Arabia and Iraq have the largest proven oil reserves on the planet. Their oil was mostly formed during the Jurassic era, 200–145 million years ago. An incredible 80 million barrels of oil are consumed by humanity each day – that’s nearly a thousand barrels per second.
SOURCES OF GREENHOUSE GASES
Carbon dioxide: mainly produced by the combustion of coal, oil and gas from fossil fuels. Also results from deforestation and land clearance, and from peat burning in the tropics.
Methane: produced in places where oxygen-free decomposition occurs, such as in rice paddies and landfill sites. Can also be released by leaky pipelines and burping cows.
Nitrous oxides: emitted from burning fossil fuels – in car exhausts, for example – and from agricultural fertilizers breaking down in the soil.
HFCs and other industrial gases: as it says, these are produced by industrial processes. HFCs were introduced as replacements for CFCs, which are now banned to protect the ozone layer. They are used in refrigerants, in aerosols and foam-blowing. SF
is used in high-voltage electrical switches, but also in that squishy bit of some training shoes, and inside tennis balls.
Gas: Much natural gas is overcooked oil, which is why oil and gas fields tend to be so closely associated. Some of the biggest gas fields lie in the Middle East and Russia. Gas is mostly transported via pipelines, though it can also be liquefied under high pressure and transported on ships. In its natural state, gas is odourless – small amounts of additives are included in the mixture in order to give it a characteristic smell, useful in detecting leaks. Leaked gas accumulating in buildings can cause deadly explosions.
GLOBAL WARMING TODAY
There is no longer any serious scientific doubt that global warming is already under way. The earth is now 0.7°C warmer than it was 150 years ago, before the Industrial Revolution began to change the amount of greenhouse gases in the atmosphere. The graph on page 16 shows how air temperatures have risen since 1850. You can see that the rise has not been uniform, but has come in two distinct blips – between 1910 and 1940, and between 1970 and today. This begs the question of why temperatures stabilized, and even cooled slightly, after the Second World War, when emissions of carbon were rising rapidly. Scientists think that the culprit may have been another pollutant, sulphur dioxide, which acts to counteract warming by reflecting some of the sun’s heat. Thus ‘global dimming’ counteracted ‘global warming’, and the two forms of pollution to a certain extent cancelled each other out. Sulphur dioxide is now produced less, however, because it causes acid rain and has nasty effects on people’s health.
GLOBAL AIR TEMPERATURE 2005 ANOMALY +0.48°C (MEAN 1961–1990)
Tip: Sulphur dioxide was one of the main pollutants in the choking London ‘pea souper’ smogs of the 1950s, which were controlled by the Clean Air Act of 1956. It was produced as a by-product of burning fossil fuels (especially coal), because of small amounts of sulphur contaminating the fuel. Low-sulphur diesel is manufactured specially to reduce sulphur dioxide emissions.
FIVE HOTTEST YEARS IN DESCENDING ORDER
Global warming impacts so far
Sea levels are rising at about 3mm per year, faster than during the whole of the last one hundred years. People in Pacific island nations like Tuvalu are already planning to leave their homelands, while cities like New York and London are threatened by rising tides.
Mountain glaciers are retreating worldwide, from the Alps to the Andes. The Alps have lost half their glacier cover since 1850. In the Andes, the melting glaciers mean that essential freshwater supplies will soon be lost for ever.
Snow cover in northern areas is decreasing, and permafrost in the Arctic is melting, causing damage to buildings and roads in Alaska and Siberia.
The melting icecap on the Arctic Ocean is affecting animals that depend on it. Polar bears have been left without ice to rest on, and some have drowned while trying to swim long distances. Walruses have tried to climb into white fishing boats, mistaking them for the ice floes that have disappeared.
Both Greenland and Antarctica are losing ice mass; Greenland now loses 250 cubic kilometres of water each year, adding to sea level rise.
Major floating ice shelves have collapsed in Antarctica. The latest was Larsen B, which fell apart spectacularly in a few days in 2002, much to the shock of watching scientists.
Droughts have increased around the world, as has the incidence of heavy rainfall, due to the speeding up of the water cycle with more energy in the atmosphere. In Mumbai, during the 2005 monsoon, nearly a metre of rain fell in a single 24-hour period (the highest total ever), killing 750 people with the resulting floods.
Hurricanes and typhoons are getting stronger, with heavier rainfall and more destructive winds. Hurricane Katrina, which devastated New Orleans,
Tip: Hurricanes get their energy from the heat of the oceans, which evaporate their water into the swirling clouds that make up these terrifying storms. So as the oceans get hotter because of global warming, hurricanes have more ‘rocket fuel’ to boost their power.
was one of the strongest Atlantic storms ever observed. Half a million people have still not returned to the ruined city, and are considered ‘climate refugees’ by some scientists.
Heatwaves have also increased in frequency and intensity. In 2003, severe heat killed up to 30,000 people across Europe. In Paris, morgues were over-flowing with the corpses of elderly people, and some had to be stored in vegetable cooling warehouses.
GLOBAL WARMING OVER THE NEXT 100 YEARS
How severe global warming gets depends mostly on how far humanity lets greenhouse gases continue to spiral upwards – and that’s where this book comes in. The Intergovernmental Panel on Climate Change, the main scientific body on this issue, states that temperatures will increase by 1.4°C to 5.8°C over the next hundred years. The key uncertainty here is not how the atmosphere will behave, but how humans will behave. Will seven or more billion humans continue to seek fossil fuel-hungry lifestyles, with cars, aeroplanes and all the rest? Or will they develop cleaner energy sources and tread more lightly on the planet? There is no clear answer to this yet – indeed the ultimate answer will depend on decisions made by each and every one of us, including you.
Here’s what – if they happen – each of these degree rises in temperature might mean for the planet and our society:
One degree
Deserts invade the High Plains of the United States, in a much worse repeat of the 1930s dustbowl. While the epicentre is Nebraska, states from Ontario in the north to Texas in the south suffer severe agricultural losses.
Mount Kilimanjaro loses all its ice.
The Gulf Stream switches off – perhaps plunging Britain and Europe into icy winter cold.
Rare species, like forest-dwelling frogs, possums and tree kangaroos, are wiped out in the Queensland rainforest, Australia, as warming erodes their habitat.
Coral reefs around the world suffer increasing losses from bleaching and are wiped out, with the Great Barrier Reef largely destroyed by 2030.
Island nations submerge under the rising seas.
Two degrees
Oceans turn increasingly acidic, further hitting coral reefs and endangering the marine ecosystem.
One summer in two has heatwaves as strong as 2003’s disaster in Europe.
THE GULF STREAM
The Gulf Stream is one part of a massive interlinked conveyor belt of currents that takes heat around the global oceans. Consider that London lies further north than Vancouver in Canada, while northern Scotland is at the same latitude as southern Alaska – but in both cases Europe has a much milder climate, thanks to the warm ocean currents we enjoy.
This current loses its heat in the North Atlantic and Arctic Oceans, and the water sinks to the bottom of the ocean bed. This happens because colder water is more dense and salty, and therefore heavier, driving the movement of the ‘conveyor’. The fear is that global warming will lead to a fresher ocean surface in these sinking regions due to higher rainfall and melting ice, shutting off the crucial driving point of the ocean conveyor. Indeed, a slowing of the current has already been detected by scientists.
However, there is disagreement in the scientific community as to whether this slowing is just a blip or something more permanent. Most computer models do not suggest that the shutting down of the ocean circulation would lead to a new ice age in Europe, although our weather might still change dramatically. So the flash-freezing scenario played out in the movie The Day After Tomorrow is likely to remain fiction.
Greenland tips into irreversible melt, accelerating sea-level rise and threatening coastal cities around the world.
Polar bears, walruses and other ice-dependent marine mammals become extinct in the Arctic as the icecap disappears.
Drought, fire and searing heat strike the Mediterranean basin.
Declining snowfields threaten water supplies in California.
A third of species worldwide face extinction as the climate changes.
Three degrees
The Kalahari Desert spreads across Botswana, engulfing the capital in sand dunes, and driving millions of refugees out to surrounding countries.
A permanent El Niño (see tip, right) grips the Pacific, causing weather chaos around the world, and drought in the Amazon.
Water runs short in Perth, Sydney and other parts of Australia away from the far north and south.
Agriculture shifts into the far north – Norway’s growing season becomes like southern England is today. But with declines in the tropics and subtropics due to heat and drought, the world tips into net food deficit.
The whole Amazonian ecosystem collapses in a conflagration of fire and destruction – desert and savannah eventually take over where the world’s largest rainforest once stood. Huge amounts of carbon pour into the atmosphere, adding another degree to global warming.
Hurricanes strike the tropics that are half a category stronger than today’s, with higher wind speeds and rainfall. Wind speeds in the strongest storms could rise to 200 miles per hour.
The Indus River runs dry due to glacial retreat in the Himalayas, forcing millions of refugees to flee Pakistan. Possible nuclear conflict with India over water supplies.
Four degrees
Most of the Nile Delta is threatened by rising seas, as is a third of Bangladesh. Tens of millions more become climate refugees.
West Antarctic ice sheet potentially collapses, pumping five metres of water into global sea levels.
Tip: El Niño is the name given to a reversal of currents in the east Pacific Ocean, which brings warm water to the coast of Peru, sparking rainfall in areas that are normally desert. In contrast, the lush forests of Papua New Guinea, where the rain usually falls, bake in drought. El Niño, in fact, changes weather across the globe.
Southern Europe becomes like the Sahara, with deserts spreading in Spain and Portugal. People move north into temperate refuges in Scandinavia and the British Isles, which become increasingly overcrowded, resulting in further conflict.
All glaciers disappear from the Alps, further reducing water supplies in central Europe.
Permafrost melt in Siberia releases billions of tonnes of methane and carbon dioxide, meaning that global warming spirals upward.
Five degrees
Earth hotter than at any time for 55 million years.
Desert belts expand from the subtropics into temperate regions. Civilization collapses as humanity is unable to cope.
Methane hydrate is released from underneath the oceans, sparking tsunamis in coastal regions and pushing global warming into an unstoppable spiral.
Much of the world is uninhabitable.
Six degrees
Mass extinction scenario: the end-Permian mass extinction 251 million years ago was associated with six degrees of warming, and wiped out 90% of life on earth. No one is sure what happened, but a combination of volcanic CO2 releases and methane hydrates may have been the cause. (This was much worse than the end-Cretaceous mass extinction, 65 million years ago, which wiped out the dinosaurs.)
Huge firestorms sweep the planet as methane hydrate fireballs ignite.
Seas turn anoxic (without oxygen) and release poisonous hydrogen sulphide.
Humanity’s very survival as a species is in question.
(Note: this list is a very potted summary of a book called Six Degrees, also by Mark Lynas, published in March 2007 by Fourth Estate.)
If none of this sounds very appealing, then you’re reading the right book. This guide aims to show how you can help to avoid these disasters by reducing your personal contribution to global warming. The table on page 29 indicates the changes that are needed on a global scale to avoid each successive degree of global warming.
TWO DEGREES – THE TARGET
You might have noticed from the discussion above that there are certain ‘tipping points’, after which global warming could become unstoppable. Several of these could be reached if temperatures cross the two degrees threshold, because at this level of warming, greenhouse gas releases from the soils and forests could take on their own unstoppable momentum. That would leave humanity powerless to intervene as our planet began cooking. For this reason, many environmental groups and even governments (including the European Union) have begun to fix on the target of two degrees as a danger level that must not be crossed.
The graph on pages 20-1 shows how high temperatures might rise, in comparison to their levels over the last millennium. Note that the two degrees danger line is well below most of the scenarios for temperature change by 2100.
Staying below two degrees with any level of certainty would require global greenhouse gas emissions to peak by 2015 – quite a tall order, especially given the reluctance of many people and nations to face up to the scale and urgency of the problem. However, even if we overshoot this target, any cuts we do make will still help to slow the rate of change. At the very least, this gives human societies and natural species more time to adapt to rising sea levels, harsher weather and shifting climate zones. So it’s not too late to act, but time is rapidly running out, and the era of procrastination is definitely over.
WHAT IS A CARBON FOOTPRINT?
In short, a carbon footprint is a measure of an individual’s contribution to global warming. Almost every energy-consuming activity we engage in has a carbon cost. Sometimes this carbon expenditure is obvious, such as the exhaust belching out of the back of a ‘Chelsea tractor’ 4x4 on the morning school run. At other times it is less obvious, like the ‘food miles’ inherent in imported produce we might buy at a
supermarket. Your carbon footprint will be impossible to pin down exactly, but getting a general idea will help you to reduce your impact on the climate.
Many people (especially those who work in the fossil fuel industries) suggest that getting to grips with climate change will require terrible wartime-style sacrifices, where we all have to sit shivering around a single candle all winter while wearing five jumpers. But actually, reducing your carbon footprint is surprisingly easy, and not only does it not require hair-shirt sacrifices, it will probably increase your quality of life substantially. Cycling or walking rather than driving, eating local produce rather than supermarket junk and having some solar panels on your roof are hardly going to bring your world to an end. Sandals are, of course, optional.
Some comparisons between countries
We’ve all heard the cliché that Americans are greedy polluters, while Africans have a much lighter impact on the planet. But is it true? Different countries have radically different carbon impacts, depending on their pattern of development and the lifestyles of their citizens. America is in fact quite near the top of the global warming polluters’ league table, with almost 20 tonnes of carbon dioxide emitted per person. But the United Arab Emirates and Qatar, with their oil-rich economies, have twice the per-person impact of the US.
European countries tend to have about half the per capita emissions of the United States: the UK, for example, has 9.4 tonnes to America’s 19.8. So our carbon footprints are only half as large as those of the average American. But they are still big on a global scale – each Brit produces ten times as much CO
as each Vietnamese. Global warming naysayers are fond of pointing the finger at China and India, as if they are to blame for the problem. But China’s emissions are only 3.2 tonnes per person while India’s are 1.2 tonnes per person.
Africa is often forgotten altogether, and African per capita emissions are indeed minuscule in comparison to ours. Tanzania’s people emit only 0.1 tonnes each – one hundredth of our per-person total – while Chad
Tip: At the moment it is not possible to say when each degree of temperature rise will be reached – because that depends on decisions we have all yet to make. If we continue to increase carbon emissions, we might reach two degrees as soon as 2030. But if we cut back our greenhouse gas emissions sharply, we may avoid two degrees altogether.
and Mali have emissions so low that they are not even measurable. It is interesting to note how African people are often blamed for environmental damage such as deforestation and the hunting of wildlife, but in global warming terms they are greener than green. The only exception is highly developed South Africa, which, with 7.8 tonnes per person, is nearly up to European standards. Anyone who has travelled around Johannesburg’s traffic-choked motorways will quickly understand why.
Of course, because developing countries have such huge populations, their global impact is considerable. China is the second-largest emitter in the world (after the United States, of course), with 14.5% of the world total. India is number four in the list, with 5.1% of the total, while the UK is seventh, with 2.3%. Because of their large total impact and the rapid scale of their economic development, it is clearly true that global
Tip: The UK often claims to be doing most towards bringing down greenhouse gas emissions, and the government projects that we are on target under the Kyoto Protocol to meet our reduction of 12.5% by 2012. However, a tougher government target of 20% reductions by that date has now been quietly dropped, and emissions are currently rising again – thanks mostly to the general public driving and consuming more.
warming cannot be solved without engaging developing nations in the effort. But while such dramatic per capita disparities remain, China and India have a fair point in refusing to take the first steps.
Contraction and convergence
Aubrey Meyer of the London-based Global Commons Institute has proposed an international solution – ‘Contraction and Convergence’ (C&C). This proposal recognizes that the only realistic way to avoid global political stalemate is to accept the need for equity – that each person has an equal right to the use of the atmosphere. At the moment, the wide divergence in carbon footprints means that each American is using nearly twenty times as much atmospheric space as each Indian. By demanding that India makes cuts at the same time as the US, the American government is in effect proposing to cement this inequity – something the Indian government is understandably unwilling to sign up to.
C&C gets around this problem by putting in place a framework for ‘convergence’ to equity where, by a negotiable date (say, 2030), each country in the world will have an equal emissions entitlement based on its population. While all of our carbon footprints might not be the same by that date, our rights would be.
So people in rich countries who want to use more than their fair share would have to pay for the right to do so by buying unused allocations from people in poorer countries. The result would likely be a net transfer of wealth from rich to poor, which would help tackle global poverty at the same time as global warming. This wouldn’t be charity, but trade – something world leaders are more likely to sign up to.
Of course, convergence is only one half of the equation. The other would be ‘contraction’, where global emissions contract downwards towards a sustainable level that would avoid serious climate change damages.
So far, C&C has gained substantial support from the African group of nations, while in the UK it has been recommended by the Royal Commission on Environmental Pollution and the Archbishop of Canterbury. Aubrey Meyer suggests that C&C could provide a stronger framework for climate change action once the Kyoto Protocol lapses in 2012.
Kyoto and international negotiations
In theory, the international community is already committed to solving climate change, and has been for more than a decade. The UN Framework Convention on Climate Change was signed in 1992 at the Rio Earth Summit by leaders from 150 nations, including the first President George Bush on behalf of the United States. In its Article Two, it said the following:
‘The ultimate objective of this Convention…is to achieve stabilization of greenhouse gas concentrations in the atmosphere at a level that would prevent dangerous anthropogenic interference with the climate system.’
Trouble was, no one defined ‘dangerous’. Moreover, the Convention was only voluntary, without specific measures to actually enforce its stated objective. Nothing much happened as a result, and greenhouse gas emissions continued to rise after the UNFCCC was signed. In order to address this, the Kyoto Protocol was negotiated in Japan in 1997 to try to give the Convention some teeth. Industrialized countries agreed that they should take the first steps towards cutting emissions, since they were the highest percapita polluters. Different nations took on different CO
reduction targets: the United States agreed to a cut of 7%, while the EU got a cut of 8%. Japan and Canada each took on 6%, while Australia negotiated itself an increase in emissions by claiming special status as a smaller country. In total, emissions from the industrialized world under Kyoto were supposed to fall by 5% by 2012.
Kyoto was finalized amid great celebrations in December 1997, and hailed as a triumph for global environmental protection. If it had worked, perhaps this book would not have needed to be written. Unfortunately things went somewhat downhill after all the delegates went home and the ink began to dry. First, no one did anything to cut emissions. Japanese, Canadian and US emissions continued to climb steeply, despite the countries’ Kyoto targets. European emissions were more stable, largely because of the happy accident of economic collapse in post-Communist Eastern Europe, which dramatically curtailed emissions from the old factories and power stations of the Soviet bloc.
Kyoto’s negotiating process continued at annual UN summits after 1997, but each successive meeting introduced new loopholes that served to weaken the treaty. Then in 2001, a further blow came when the second George Bush pulled the United States out of Kyoto, arguing that it would be too much of a strain on his country’s economy (though many pointed at his administration’s close links with the oil industry as a deeper reason for the hostility to Kyoto). The US played a further negative role by undermining the negotiations at the UN climate summits, and by trying to organize an alliance of other Kyoto-hostile powers.
It took seven long years before the Kyoto Protocol even came into force. It finally became legally binding in February 2005 when Russia belatedly ratified the treaty. Even so, the US and Australia remain on the outside, and Canada has said that it will not be able to meet its emissions target. Within the EU, Ireland and Spain are also grossly over-budget, and may have to buy ‘emissions credits’ from more thrifty countries.
CARBON RATIONING
Many people see rationing as the only verifiable long-term way to get people to change their lifestyles. It’s the ultimate in carbon footprinting: rather than each individual having to work out their footprint using calculations like the ones later in this book, it would all be done automatically, perhaps with an electronic card. Each time you fill up the car, you would have to
Tip: It’s not all bad news on the US front. Following the lead of Seattle’s Mayor Greg Nickels, by September 2006, 295 city mayors, representing fifty million Americans, had pledged to implement the Kyoto agreement in their localities.
swipe your carbon ration card and surrender some units. You would also need enough carbon ration to cover your heating and other domestic needs.
The beauty of carbon rationing, according to its proponents, is that it would be government-enforced – making it much more likely to work than voluntary approaches. Because each person starts off the year with an equal ration, it would also be fair, just as everyone during the Second World War had an equal allocation of food and other necessities in order to jointly share in the war effort. One difference from wartime rations, however, is that carbon rations would be tradeable. This would introduce some flexibility – if you really have to have that power-boat, then you can buy an unused ration from someone who is happy to forgo such luxuries. The financial incentives would therefore reward those who kept their carbon emissions low, because they could sell their unused ration on the open market.
At the moment, things work the other way round – it is often cheaper to be energy-profligate. Budget
Конец ознакомительного фрагмента.
Текст предоставлен ООО «ЛитРес».
Прочитайте эту книгу целиком, купив полную легальную версию (https://www.litres.ru/mark-lynas/carbon-counter/) на ЛитРес.
Безопасно оплатить книгу можно банковской картой Visa, MasterCard, Maestro, со счета мобильного телефона, с платежного терминала, в салоне МТС или Связной, через PayPal, WebMoney, Яндекс.Деньги, QIWI Кошелек, бонусными картами или другим удобным Вам способом.